
Information Design
Information Design, Data Visualization,
Storytelling, Print, Digital
Facts often tell the best stories. Each of these pieces uses specific facts to walk the viewer through a specific scenario, explanation or process.

Public Broadcast
An infographic poster documenting the positive and negative comments made during a four hour radio talk show, in which the DJ spoke about her New Year’s Eve, her boyfriend, his ex-girlfriend and a party bus.

On December 31, ten school buses were filled with fifty people each to celebrate New Year's Eve by traveling from bar to bar in Portland, OR. Among the group were a radio disc jockey, her boyfriend, his ex-girlfriend and a mutual friend to everyone. Facing a probability of less than 1%, the individuals were all on the same bus. A good time was had by all. On January 5, the disc jockey spoke publicly on her radio show about the New Year's Eve festivities.
The orange lines are a reflection of all comments about “Mary” the ex-girlfriend, and the blue lines are about “The Comedian” – the DJ’s boyfriend.

A relationship meter sits at the bottom, detailing the status of the relationship between The Comedian and The DJ during the four hour show.

Social Design: A Survey
Creative direction: Dungjai Pungauthaikan
Art direction and design: Ashley Stevens
While social design often has great intentions, projects can sometimes have unintended effects on the intended recipients or region. Social Design: A Survey worked with the editors of Metropolis magazine to evaluate high-profile social design projects over eight years and whether or not the project achieved its intended outcome. The projects are overlay a world map to illustrate if particular regions have had more successful or unsuccessful projects.


Green Choices, On the Fly
Creative direction: Dungjai Pungauthaikan
Art direction and design: Ashley Stevens
As part of Metropolis’s technology issue, we ran two standard products—a flashlight and a video game controller—through Autodesk’s latest software, the ecomaterials advisor. The feature walks readers step-by-step through the process, analyzing where structural and manufacturing changes can be made in each product’s development, affecting the overall carbon footprint.
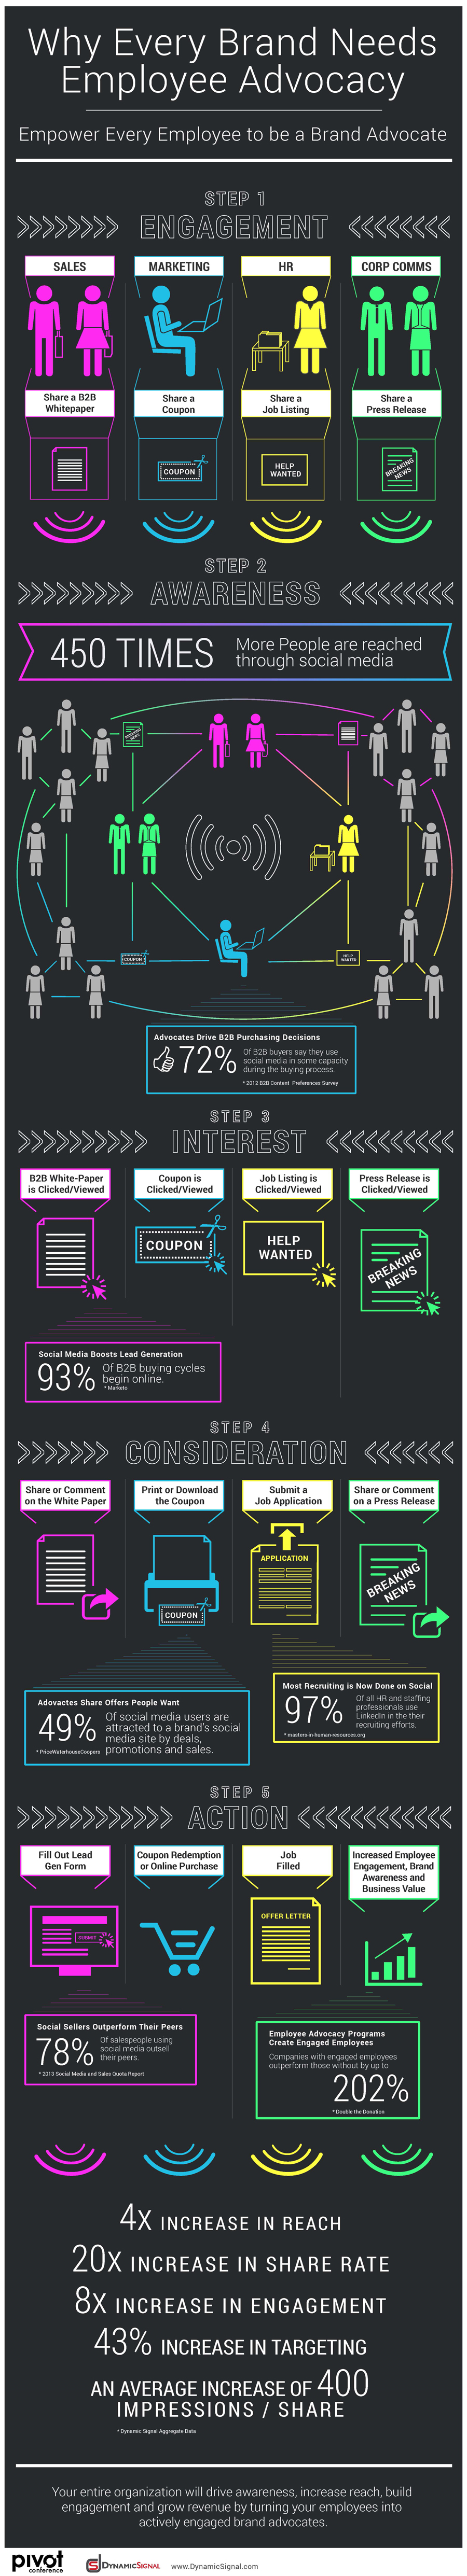
A printed banner for Dynamic Signal's booth at the Pivot Conference, illustrating the five steps needed to convert an employee into a brand advocate. See full banner here.